 Common Information to Microanalysis
EPMA Info1
Info2
Info3
Info4
Info5
Info6
Info7
Info8
Micro-XRF
Info1

Evaluation of X-Ray Spectra Measured with Energy Dispersive Xray Spectrometer (EPMA)
The energy dispersive measured EPMA-spectrum results from overlay of characteristic and continuous x-ray. The radiation produced in the sample is absorbed in both, the sample (self absorption) and in the entrance window of the detection system. This absorption is energy-dependent and additionally affected by the abrupt jumps of mass absorption coefficients, by the so-called absorption edges.
The positions of lines (peaks with appropriate energies) give information about the qualitative composition of the sample. The number of the X-ray quanta is the measure for the concentration of the elements (peak-height or pak-area). There is not linear connection between quantum numbers and concentration portions of the elements.
The concentration calculation needs the net count rates or from it derived measured variables. The following work steps (1.-4.) are necessary during the evaluation of energy dispersive measured spectra, before the computation of the element concentrations are possible (5):
1.
Spectrum correction
2.
Identification of the lines (qualitative analysis)
3.
Bremsstrahlung computation (background approximation)
4.
Deconvolution (determination of the net counts without line overlays)
5.
Computation of the concentrations from the net count numbers (or derived values)
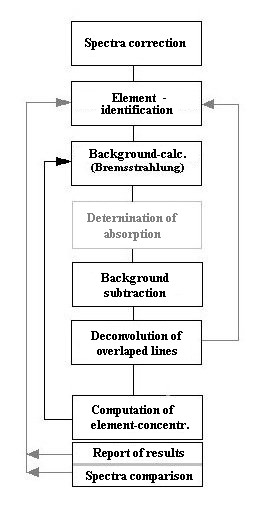 Principle Pprocesses of a spectrum evaluation (PUzaf)
The systematic and statistic errors in the spectrum correction, bremsstrahlung computation and deconvolution settle in the final error of the determined measured concentrations. The choice of the correction model, i.e. e.g. whether net impulse numbers of Ni or the ratio from characteristic and bremsstrahlung count numbers (P/U)i are used for quantification, affects the requirements to the bremsstrahlung computation (background determination). On the other hand the remsstrahlung is also an analytic measured information source about the sample, whose use became possible by the energy dispersive spectrometer (EDX). Only the EDX is able to acquire all kind of X-ray quanta in same time. Since a decnvolution contains always additional error components, optimized strategies are favourable. So not-overlaid lines can be evaluated by summation of channel contents in a certain energy region faster and less faulted. If the bremsstrahlung approximation with physically deduced analytic expressions takes place, then these computations on basis of an accepted sample composition (0. estimation) are accomplished, before the actual concentration determination can take place. With large changes of concentration according to the correction calculation compared with the values taken for the bremsstrahlung computation an actualization of the bremsstrahlung computation can become necessary. That is in particular the case, if large edge jumps (absorption discontinuities) are present in the bremsstrahlung spectrum.
Spectrum correction
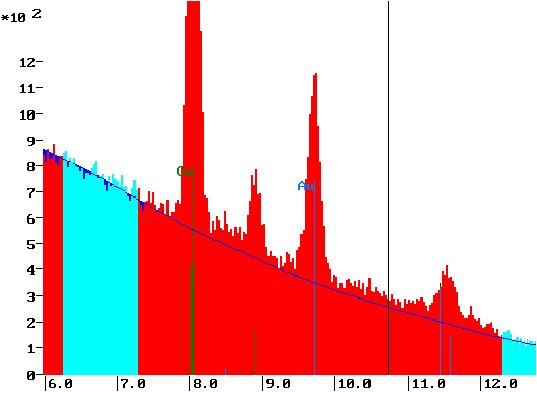
Only the escape effect is mostly corrected automatically. Escape-peaks can lead to the acceptance of wrong elements and pretend increased concentrations, if they are superposed with characteristic lines of other elements. An escape peak develops, if not the entire energy converts into electron-hole-pairs during the interaction processes of X-ray quanta with the Si-crystal of the detector. There is a probability to 'escape' a Si-K X-ray quantum from the detector and thus to the total yield of the X-ray quantum does not contribute. A reduced energy count develops (decreased by the energy of the Si-K radiation). See the example, the Ti-escape peak pretends another characteristic line. Only after the escape correction processed the spectrum, it is evident that at this energy only the bremsstrahlung underground is:
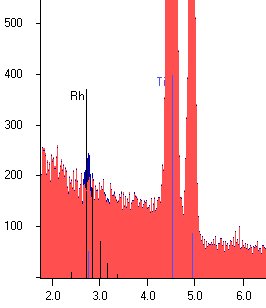
Escape correction of a spectrum
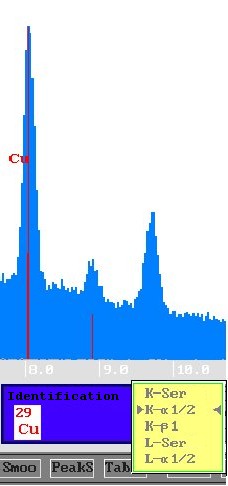
element identification with line marker
Element identification
The qualitative spectrum evaluation appears as the simplest step after the spectrum acquisition. For the decision for an element is present in the specimen, the analyst has to decide only on the basis of line-marker peak positions and their height ratios within a line series, whether it is fitting to the spectrum, or not. Usually by the software a whole set of functions are offered. If the evaluation takes place interactively or manually, then the analyst has the decision for which elements are present. The comparison of the peak position in the spectrum with the displayed line marks gives an answer in most cases. Second decision is, which lines are to be quantitatively evaluated.
Element identification methods:
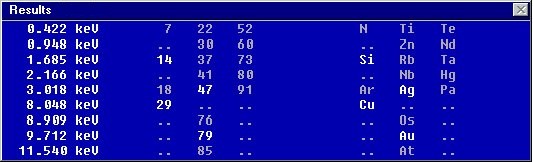
> energy tables
determination of the line energy (spectrum cursor)
and allocation to elements on the basis of line energy tables
> line marks
input of an element into the PC, which displays
marks for complete line series at the expected peak-positions
> peak identification
selection of a peak (marked via spectrum cursor), automatic search for
elements in the atomic data base and final decision of the operator
> automatic peak-search
automatic search of peaks in the spectrum, then
the same procedure like with peak identification
> automatic identification
automatic peak-search, then fully automatic
self recognition and decision over the qualitative sample composition
Automatic peak-search and element recognition
Possible elements are rejected automatically by the search for related lines or also by a list of forbidden elements.
Background computation
The background-modelling plays a crucial role for a standard-free quantitative evaluation.
A bremsstrahlung calculation performs first time the computation by assuming a concentration, which is computed after the element identification, usually not visible by the operator. The bremsstrahlung is thus calculated with the suggested parameters, absorption in the detector window, geometrical conditions during the analysis and this current accepted specimen-composition. The correction calculation checks therefore the final result and compares with the acceptance during the last bremsstrahlung computation and starts (if necessary) a renewed background computation.
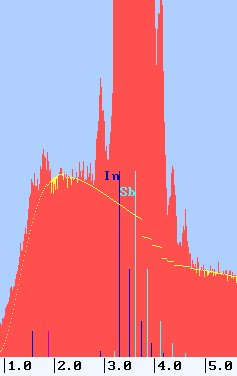 Computation of the background by modelling of the bremsstrahlung
Deconvolution of overlaped lines
Due to the interaction effects in the detector and due to the electronic noise of the signal amplifiers, the line widths are broadened. This leads often to the fact that lines of different elements are superposed. The determination of the net pulse counts are not possible by summation of all channel contents. So-called deconvolution programs extract the portions of the individual elements from the "spectrum mountains".
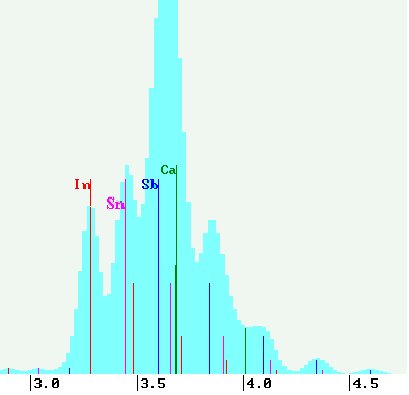 Difficult but a task, possible to solve for "deconvolution"
Further information for the deconvolution of overlaped lines:
Info5

Concentration computation
The concentrations are determined from the pulse counts without standards, computed after the background-stripping and peak-deconvolution processes. For the standard-free correction model PUzaf,
EGGERT, F.; HECKEL, J.
Experim. Techn. d. Physik 34 (1986) 201
or
PDF-File
(0,2 MByte)
different, relatively complex analytic expressions are used including atomic data (cross-sections, mass absorption coefficients, fluorescence yields...).
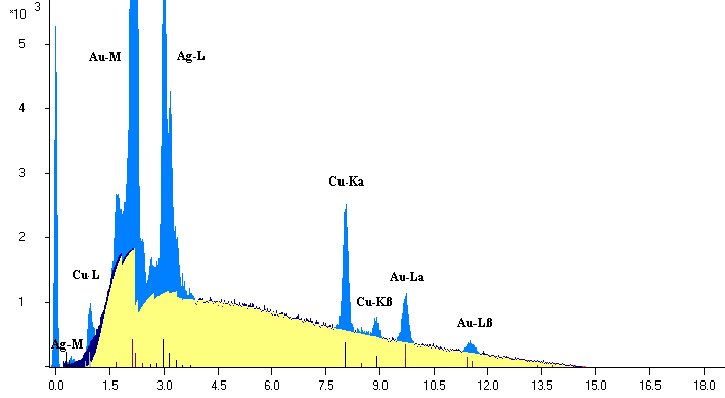
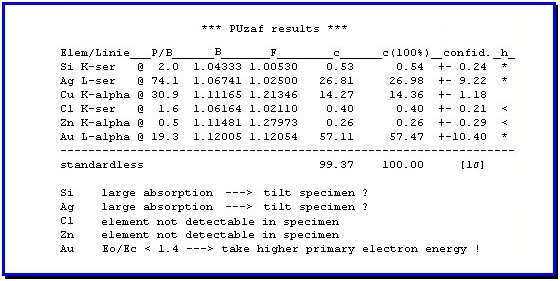
The spectrum of a gold-ring represented on the MICROANALYST.NET side represents a sample with approx. 58 % gold content, 15 % copper portion and 27 % silver. The gold L-line is nevertheless substantially smaller than AG-L and Cu-K! Only in the comparison of the Au-M line-series with Ag-L and Cu-L the element contents are reflected into expected peak-heights.
There is thus no linear connection between measured count number and the concentration. In the example the Gold-L line is the intensity-poorest line in the entire spectrum. Gold presents however 60% of the element content. The reason is the relatively bad excitation of Au-L with 15 keV (see Info1 ). A 'semiquantitative' analysis after evaluation of the peak intensities is not possible. It is to be warned here: Both, the excitation effects and the absorption are extremely nonlinear within the sample. A double count rate of an element in a sample in relation to a comparative measurement of a sample with other matrix-elements does not be an evidence for a double concentration. The concentration can be also the half (even with identical measurement conditions). That is the reason why the quantitative EPMA was marked with 'not possible', years before.
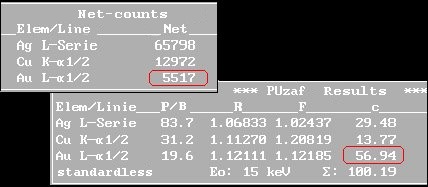
The quantitative results in the EPMA are always determined into per cent mass concentration. If no element determination took place by difference to 100 per cent, the results are primarily not normalized, since absolutely determined. All other result-outputs for concentrations are normalized to 100 per cent, e.g. normalized mass per cent, atomic per cent or per cent of oxides are given. An other possibility is to standardize on ratios in an elementary cell (given number of atoms). All these result outputs are calculated from the basic computed results. A flexible software offers these different result presentation options.
Commonly the errors of the computed concentrations depend primary on the pulse statistics. Apart from this statistical error, which can be minimized by using a long acquisition time, all steps during the spectrum evaluation can contribute to different systematic errors (bremsstrahlung approximation, computation of the absorption edges, deconvolution errors, errors of the atomic data and the model system of the correction computation, error in the knowledge of the experiment-conditions - e.g. the primary electron energy). A computation of errors, which covers all of these influences, helps the analyst with the evaluation of the results.
If the error contributions are checked in detail, valuable hints to the evaluation of the results and to the optimization of the experiment conditions can be given to the analyst. In the example the reasons for the large errors of the elements Ag and Au are given.
Spectrum comparison
A spectrum comparison between the measured and the reconstructed spectrum (computed from the results of the spectra-evaluation) supplies optical check, whether the spectrum evaluation ran correctly, or not.
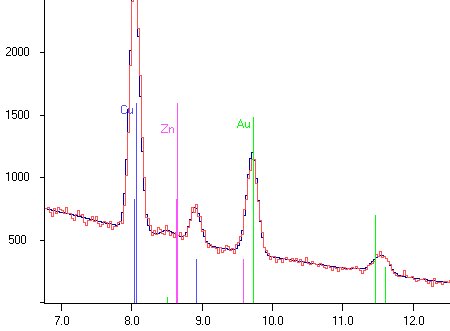 Comparison between the measured and the
reconstructed spectrum
The sum of the absolutely calculated single concentrations, the comparison with the reconstructed spectrum (evaluation of the correctness of the bremsstrahlung computation, the deconvolution of overlaped lines and the correctness of the qualitative analysis) and some attention to the calculated errors are the main criteria for it whether a quantitative analysis ran correctly and the analyst can trust the results. If the comparison of the reconstructed spectrum with the acquired spectrum is satisfying and if a sum of the not normalized element concentrations of 95... 105 % is proven, then the standard-free determined element concentrations are very reliable as 100 per cent normalized values within the given error limits. Accuracies of the results of analysis of 3...5% relative errors are attainable for the K-radiation. For L- and M-radiation the errors can become larger.