 Common Information to Microanalysis
EPMA Info1
Info2
Info3
Info4
Info5
Info6
Info7
Info8
Micro-XRF
Info1

Deconvolution of Line Overlaps
X-ray line width are measured more broad than expected from physical basic processes. That is due to both, the physical X-ray interaction processes in detector and the electronic noise of preamplifier circuit. X-ray lines are detected with line width, which lead often to the fact that lines of different elements overlay. The determination of the net counts is not longer possible by simple summation of all peak channels.
It is the task of software to drop out from the spectrum-mountains (which consist of different additive element line-series) the individual element contributions again by a mathematical procedure. Since the widening of the lines can be described by the spectrometer mathematically with a "folding" or "convolution", the reverse process is called "deconvolution". Thus the software must perform spectrum deconvolution in many analytic cases.
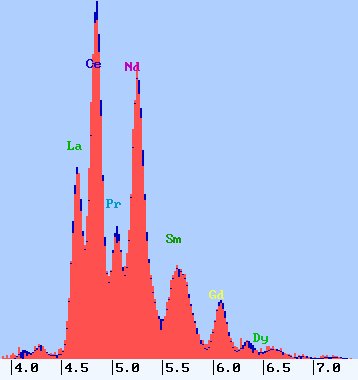 Original acquired spectrum in comparison to artificially sum spectrum after deconvolution displayed for comparison
(spectra reconstruction: blue)
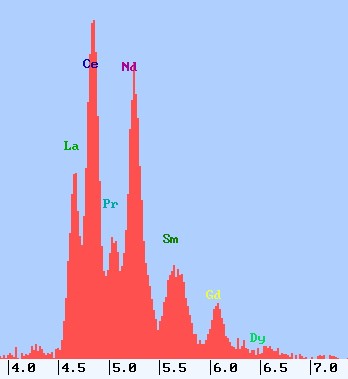
The overlays with the L-series are most dramatically, since each element many lines emitted and neighbouring elements energetically closely together lie. The most challenge for each X-ray spectrometer is a Monazit spectrum, which is to serve here as an example.
One can check the quality of the spectrum deconvolution usually only from how the reconstructed spectrum in the comparison to the measured looks. Some procedures supply also a "quality value" as an unique number, which should be a statement about the reached approximation quality (e.g. "chi square").
The complexity of the task of deconvolution software can be presented better with overlayed presentation of individual line series (components of the measured spectrum):
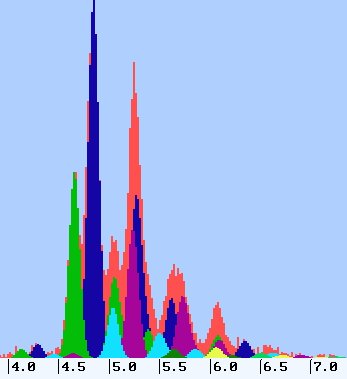 Real acquired spectrum compared with the single spectra of all elements determined with the deconvolution
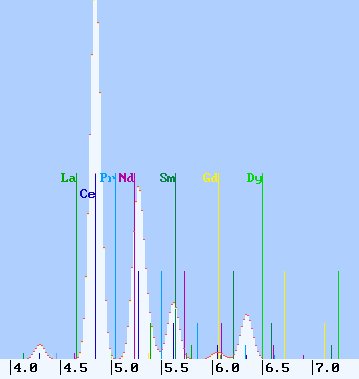
To the elucidation of the deconvolution problem the following picture points out the line density with line marks in comparison to only one individual L-line series of the element Ce :
Theory:
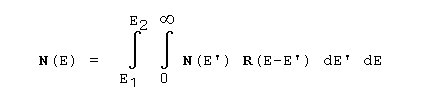
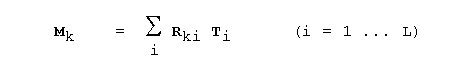
A transformation of the X-ray emission spectrum into a digitized pulse heigt spectrum can be described under neglect of the spectrometer efficiency and the emitted background (to become separately considered during the evaluation) with the function of representation R:
N(E')
pulse count distribution of emitted characteristic radiation
N(E)
acquired count rate of characteristic X-rays in energy region E1 to E2
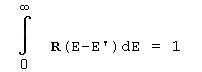
It applies:
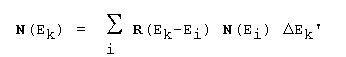
Assuming a measured discrete count height distribution, the result is:
Rki
response function (function of representation, folding, convolution)
Mk
acquired count rate in channel k of a fixed width of one channel
Ti
emitted line-series count-rate of an element i
L
number of line series (elements)
If the number of the regarded channels is equal to the number of the elements, then the set of equations can be change to the Ti and thus one is immediately able to solve. The number of the unknown variables is equal to the number of the equations.
Also the "region of interests ROI" can be taken for channels, which selectable during element identification (for each element an energy region is selected). If no overlap exists, then the Rki are equal to 1.
Thus the emitted count rates correspond exactly to those in the "channel" measured. We have the "trivial" solution of the set of equations. By summation of all pulse counts in the energy region of a line series one receives the wished emitted counts of X-ray quanta.
With little overlaps of peak series the Rki are no longer identical to 1. The solution of the set of equations leads to the so-called "overlap correction".
With complex overlaps of line series the set of equations is no longer feasible by the simplification K = L with selection of line ranges. All channels of a spectrum range, in which a line overlay is, must be considered. Since the number of the channels K is > L, the set of equations is over-certain.
The Deconvolution Model Fit:
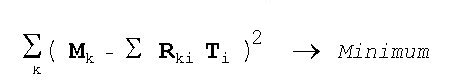
A criterion is used, in order to solve the over-certain set of equations. The sum of all squares of the deviations of each channel is to be minimized between model line series and real acquired spectrum . This method is actually a linear parameter optimization and thus no genuine deconvolution. In the literature frequently is used "Fit" or "least squares fitting".
The solution leads to a linear set of equations. The criterion of the least square minimization is relatively arbitrary. Often also still weighting factors are introduced, in order to minimize e.g. the influence of small channel contents to the result of computation (statistic errors!). The optimization of nonlinear parameters (peak positions or peak widths) leads to a nonlinear parameter optimization, which is iterative solved. The so called 'chis square' is often used as a value, which can describe the residual sum of all deviation-squares. Therefore 'Chi square' is a quality factor for the fit.
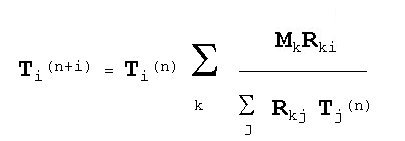
The Deconvolution Model Bayes:
The Bayes deconvolution is an iterative method. It is a genuine deconvolution method and thereby modelled mathematically the actual statistic processes, which lead to the widening of the lines and thus to line overlaps.
With an iterative working method convergence difficulties are not completely excludable. A set of precautionary measures and accelerations within the iteration can fully avoid convergence problems.
Normally the analyst is content, if the software contains a spectrum deconvolution and solves the overlap problems at all. Often it is however useful to know something about the programs working as black box:
A disadvantage of the Bayes deconvolution opposite a linear Parameteroptmierung with Fit is the somewhat larger susceptibility in relation to errors in the background determination. That is because the parameter optimization according the model set (minimization of the discrepancy squares between model and spectrum) always prefers the high counts. However, these high counts are most insensitive in respect of the background calculation errors.
A accurate background approximation (so correct as possible) should be, however, so or so a basic condition for the minimization of the analytical errors. The Bayes deconvolution is much better according to all further criteria than the Fit procedure.
That is particularly because their mathematical modelling with the probability theory meets most the reality of the actual physical processes (statistical processes of charge collection in solid state detectors). The parameter optimization is rather a pure mathematical method and thus limited in efficiency in the case of model errors.
Errors in the energy positions, in couple factors of the individual lines of an element line series, changed resolution of the spectrometer, deviations from the Gaussian shape of the peaks and even the pulse statistics ... all of them have a substantially smaller influence to the deconvolution results of a Bayes deconvolution procedure (compared with Fit).
If the overlaps are going to be weaker, the still-remaining errors decrease more and more. Then the ability strength of the Bayes deconvolution steps out, ever more clearly.
With deeper interest with further literature sources:

EGGERT, F.; SCHOLZ, W.
phys. stat. sol. (a) 97 (1986) K9